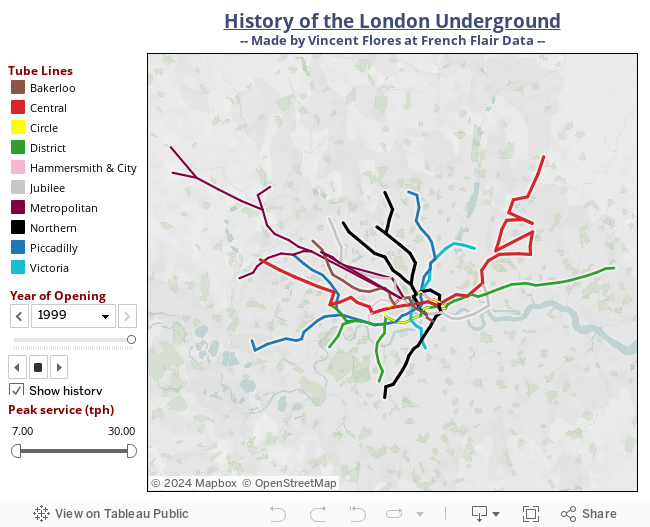
With the Olympics madness in London right now and the public transportation fully packed, I thought it would be interesting to look at the subway, called the Tube on this side of the pond. As resident of London and daily commuter, I was really curious to know more about the history of the Tube. In order to visualize its historical development I used Tableau software to create this Viz. The path shelf feature was particularly useful.
Source: Wikipedia
About me: French professional and happy globe-trotter, interested in data driven investigations in the field of politics and social trends. Currently expat in London and working for a major American litigation and financial investigations consulting firm, dealing with large data sets and visualisation tools for international clients and corporations.
About me: French professional and happy globe-trotter, interested in data driven investigations in the field of politics and social trends. Currently expat in London and working for a major American litigation and financial investigations consulting firm, dealing with large data sets and visualisation tools for international clients and corporations.
Which tool did you use to get Long. Lat. of each metro station?
ReplyDeleteNothing to fancy for this one I am afraid, just got it from Wikipedia.
ReplyDelete